
Daily Revenue Reports
To see your company revenue for daily reports, (see video here) you'll go to your Settings -> Filters -> Create a filter. You can name and create as many filters as you'd like, depending on how you would like your report to generate. See example: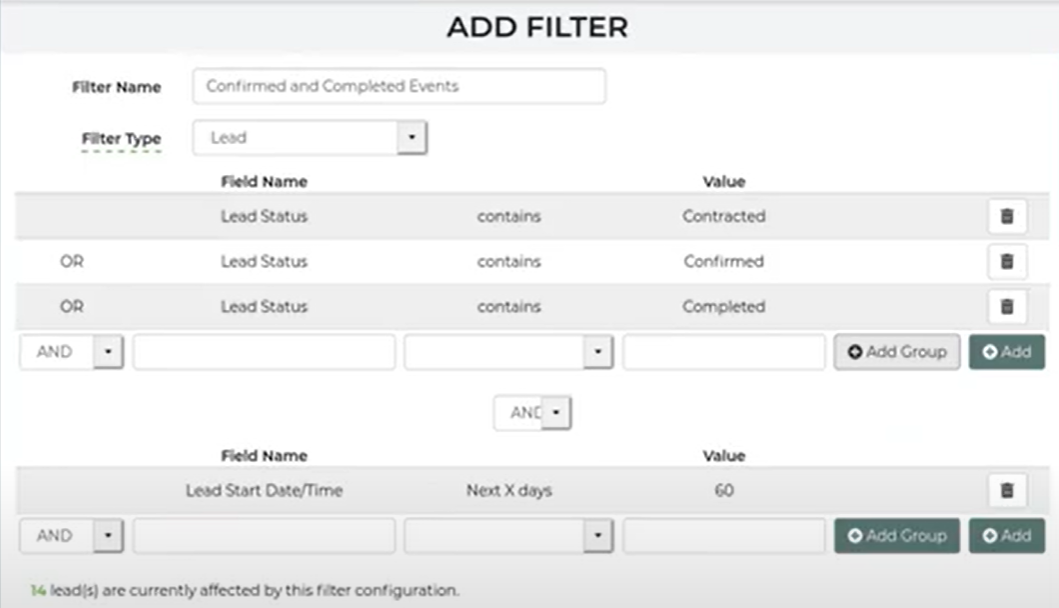
Once your filter is saved how you would like, Save the filter.
After you have created a filter, you'll go to Settings -> Reports and add a report. This can also be named anything you'd like. Your column name should be categorized as: Lead Start Year-Month-Day. This will look like 2022-05-26, for example.
Select Group By and Sort By. Your second Column Name will be Lead $ Paid. Your third Column Name will be Lead $ Balance Due. Your fourth Column Name will be Lead $ Total. You can select the Sort Direction to your liking. The filter you will apply will be the one you created.
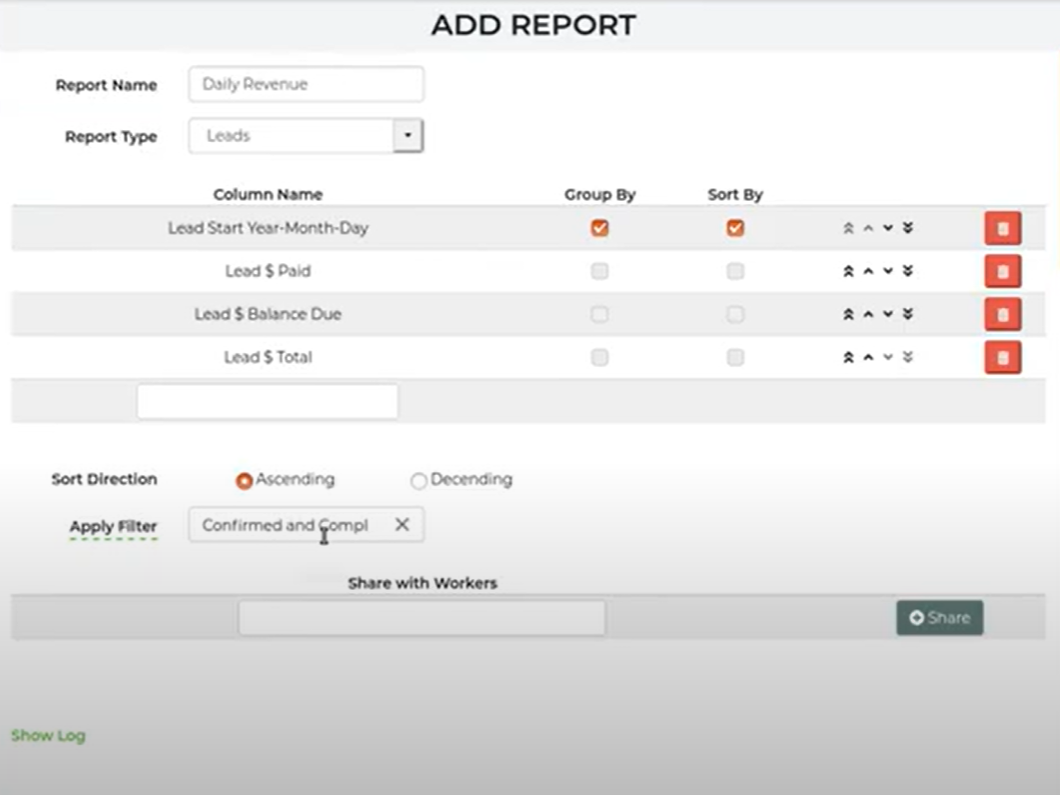
You do not have to use the filter you created if you are not looking at that specific report. The filter can always be changed. Save and close.
Go to your leads page, and find your report.
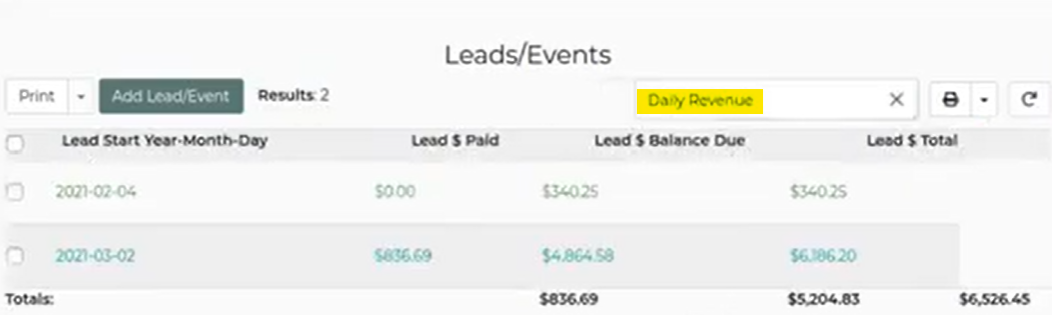
This will show you the filters applied; what's been paid, what's due and your total. You can temporarily change your filters applied by selecting the filter name: 
To add a Dashboard data table, go to your Dashboard -> Name should be similar to the report type. Select your Report (the one created) -> Time Period should be "Use Filter" -> Time Value should be Lead Start Date/Time -> Filter should be the filter you created for your reports. Create your report.
The report will show you what's been paid, what's due and what the total is for 60 days, per your filter.