
Customizing Your Dashboard: Charts, Layout, and Menu Names
Your Dashboard can be customized to show the charts, tables, and metrics you use most. You can add preset charts, build custom charts, rearrange the layout, rename charts, and use icons or emojis to make items easier to spot.
Prerequisites
- Access to the Dashboard in your account.
- Permission to view and edit dashboard charts. Worker permissions may limit what you can change.
- If you want to use Sales Rep Leaderboard, the Workers module must be enabled.
- If you want to filter by location, your account must use multiple locations or your user must have location access.
Ways to customize your Dashboard
1. Rearrange charts on the Dashboard (Optional)
- Find the chart or data table you want to move.
- Click and hold the chart header.
- Drag the chart to a new position.
- Release to drop it into place.
Use this to group related charts together, such as sales charts at the top and operations charts below.
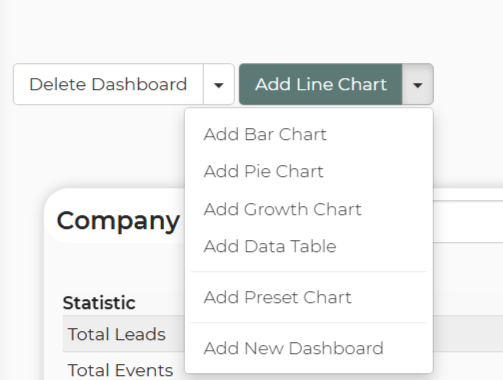
2. Add a preset chart
- On the Dashboard, Open the dropdown menu next to add line chart
- Open the dropdown menu.
- Select Add Preset Chart.
- Choose a preset chart.
- Enter a Name for the chart.
- Click Create or Save.
Common preset charts include:
- Income by Categories, Fees, Discounts
- Maintenance: Items Available
- Maintenance: Items Unavailable
- Sales Rep Leaderboard
- YTD Sales by Month
- YTD Sales Difference
3. Create a New Dashboard
- Click dropdown next to Add Line Chart.
- Select Add New Dashboard.
- Enter New Dashboard Name

- Select Create
4. Rename a chart and its menu label
- On the Dashboard, find the chart you want to rename.
- Click the settings gear on that chart.
- Edit the Name or Title field.
- Click Save or Update.
The updated name appears on the chart and anywhere that chart name is shown in the dashboard menu.
Example names:
- Logistics - Items Ready
- Monthly Category Revenue
- YTD Sales by Month
5. Add emojis to chart names
- Open the chart’s settings gear.
- In the Name field, type your label and add emojis if desired.
- Save the chart.
Examples:
- 📈 YTD Sales by Month
- 🧽 Maintenance - Items Unavailable
- 🏆 Sales Rep Leaderboard
6. Creating a custom chart
1. Select the type of chart you want to create by clicking Add Line Chart (or selecting the dropdown). Example: Line, Bar, Pie, etc.
2. Fill in the necessary fields.
3. Click Create on the right.
Feature Options & Parameters
Chart Settings
- Name / Title: Controls the chart label shown on the Dashboard and related menu items.
- Date Range: Limits data to a selected period.
- Grouping: Groups data by fields such as month, referral type, or sales rep when supported.
- Saved Filter: Applies a saved filter to a chart.
- Location: Shows data for one location when available.
Preset Chart Types
- Income by Categories, Fees, Discounts: Shows revenue by category, fees, and discounts.
- Maintenance: Items Available / Unavailable: Shows inventory availability for maintenance tracking.
- Sales Rep Leaderboard: Compares reps by Leads, Sales, $ Sales, Conversion Rate, and Close Time.
- Growth Charts: Includes charts such as YTD Sales by Month and YTD Sales Difference.
Layout Options
- Position: Move charts by drag-and-drop.
- Shared Dashboards: Dashboards and charts can be shared with workers inside your account.
Use Cases
- Role-specific dashboards: Create separate views for sales, logistics, or management by naming charts clearly and organizing them by section.
- Multi-location reporting: Create versions of the same chart for different locations or saved filters.
Troubleshooting & FAQs
I cannot edit or add charts.
Your worker permissions may not allow dashboard editing. Check with an account admin.
I do not see the location setting on a chart.
The chart may not support location settings, or your account may only have one location available to your user. For custom charts, create and apply a saved location filter.
I do not see Sales Rep Leaderboard in the preset list.
This preset requires the Workers module.
I shared a chart, but another worker cannot edit it.
Charts can be shared as either a shared editable chart or as a copy. If the worker received a copy, they can edit only their own version.