
If you are using our workers module and wanting to compare sales rep performance, we've built a great preset chart you can add to any of your dashboards. The chart will show the following statistics group by the sales rep.
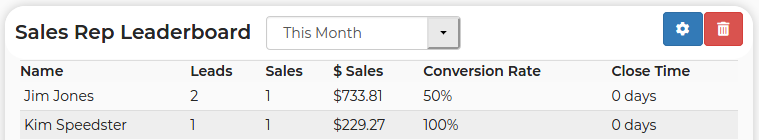
- Leads: The total number of leads assigned to the sales rep created in the period you are looking at that are not in a status that you show on reports plus all the sales in the next item.
- Sales: The total number of leads assigned to the sales rep that have a book date (date you send the contract out or they book online) and are in a status that you have set to show in reports during the period you are looking at. If no book date is set or the book date is before the lead creation date, we will use the create date of the lead for the period date.
- $ Sales: The total dollar amount of the sales listed in the item above.
- Conversion Rate: The total number of sales divided by the total number of leads.
- Close Time: The time difference of a sale between the book date and the create date.