Dashboard Chart
Answered
I set up a dashboard chart using 2/20 to 2/24 as my test time period
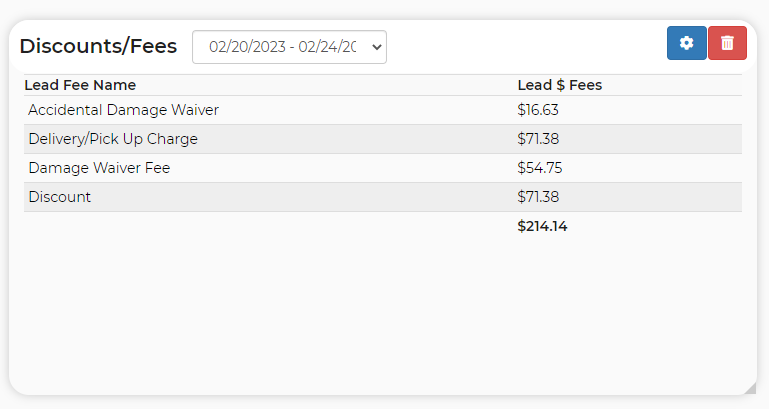
this dashboard is to show fees collected in data table

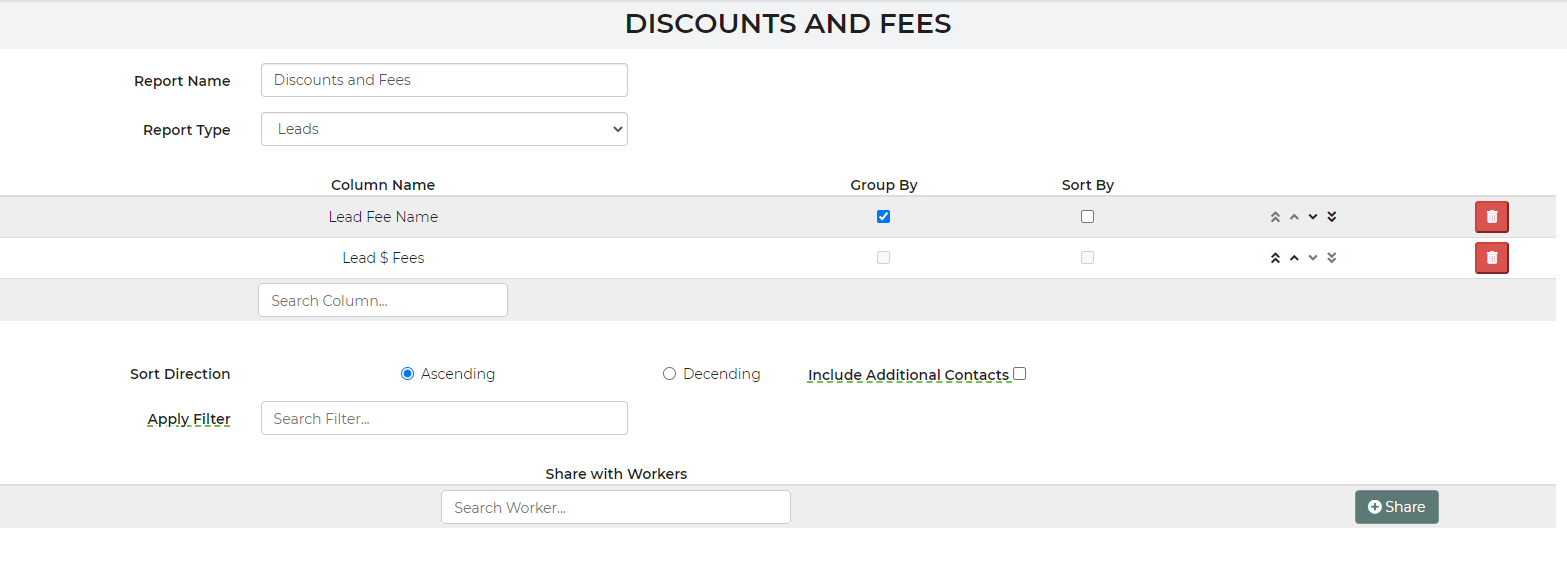
i am using my report discounts and fees

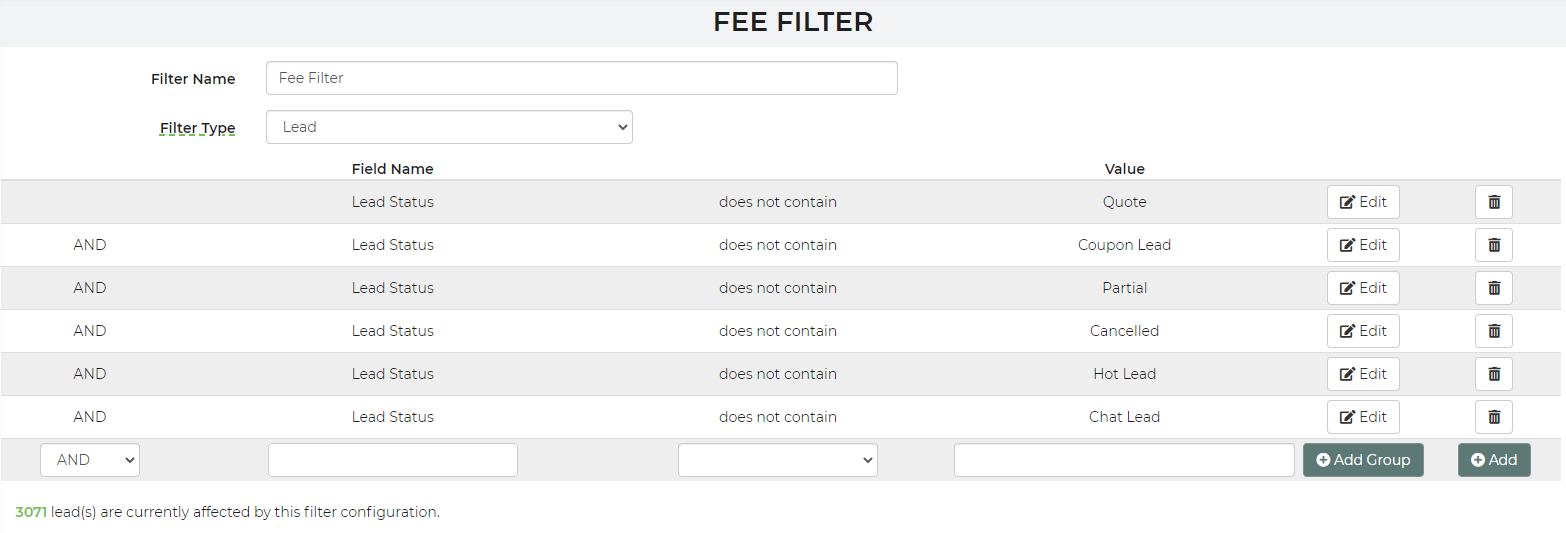
and my filter of

first the orders have no discounts but the dashboard shows 71.38
then it shows delivery 71.38 but delivery is 114.31
it shows DW (we just switched over to ADW) of 54.75 which is correct
and shows ADW of 16.63 but the real number is 53.03
now the funny thing is if you take chart numbers of the dw and the adw and add them together you get 71.38 agian meaning everyone of the fees are 71.38 which we all know is impossible
something is wrong in the math first but also in what is pulling from the leads into the report
any help would be great


 The same question
Try "lead $ Fee Price" in place of "lead $ Fee"
Try "lead $ Fee Price" in place of "lead $ Fee"
has there been any movement on this producing the wrong numbers?
has there been any movement on this producing the wrong numbers?
Replies have been locked on this page!