
This object is in archive!
Sales By Location Plot
Under Consideration
Is there a way to plot sales by customer location? ie. completed bookings
Like the attached example?
Files:
Screen Shot 202...
 I like this idea
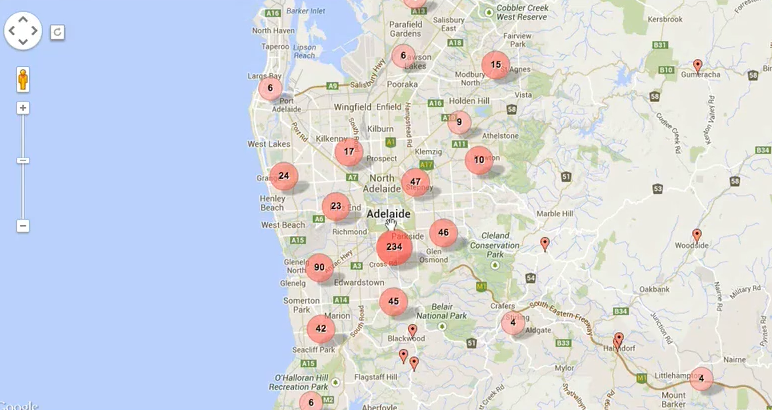
Access denied
This is a good idea. I've added it to our list for the Dashboards page. In your example, what does each dot represent? The center of a zipcode? I'm wondering how they decided to group them together (I'm assuming the number in the dot represents multiple events in the area close to that "pin")
This is a good idea. I've added it to our list for the Dashboards page. In your example, what does each dot represent? The center of a zipcode? I'm wondering how they decided to group them together (I'm assuming the number in the dot represents multiple events in the area close to that "pin")
Replies have been locked on this page!